简体中文
繁體中文
English
Pусский
日本語
ภาษาไทย
Tiếng Việt
Bahasa Indonesia
Español
हिन्दी
Filippiiniläinen
Français
Deutsch
Português
Türkçe
한국어
العربية
Sterling Price Outlook: British Pound Snaps Four Week Losing Streak
Özet:Sterling is poised to snap a four-week losing streak with price rebounding off downtrend support this week. Here are the levels that matter on the GBP/USD weekly chart.
British Pound responds to downtrend support; short-bias vulnerable near-term
Check out our 2019 projections in our Free DailyFX GBP/USD Trading Forecasts
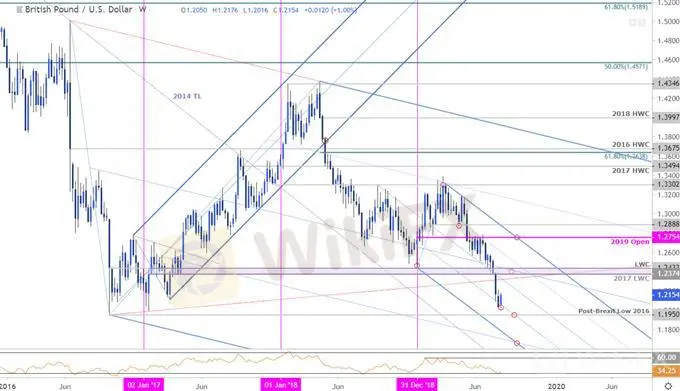
Sterling prices fell to lows not seen since January of 2017 early in the week before mounting a nearly 1% advance – the move offers a reprieve to the British Pound which has fallen nearly 10% off the yearly highs. But is this just a near-term relief rally, or the start of something bigger? These are the updated targets and invalidation levels that matter on the GBP/USD weekly price chart. Review my latest Weekly Strategy Webinar for an in-depth breakdown of this gold price setup and more.
Sterling Price Chart - GBP/USD Weekly

Chart Prepared by Michael Boutros, Technical Strategist; GBP/USD on Tradingview
Notes: In my last GBP/USD PriceOutlook we noted that Sterling was approaching a critical support confluence at, “1.2374-1.2433 – a region defined by the 2016 post-Brexit low-week close and the 2017 low-week close... A break / weekly close below would expose subsequent support objectives at the 61.8% extension at 1.2185.” Price plummeted through this target last week before briefly registering a low at 1.2013 early in the week. Sterling is responding to slope support on numerous timeframes here with price now poised to snap a four-week losing streak.
Initial weekly resistance stands with the median-line (currently ~1.23) with key resistance / near-term bearish invalidation now lowered to the 1.2374-1.2433 pivot zone. A break lower from here exposes the post-Brexit lows in GBP/USD at 1.1950; look for a reaction there IF reached – any lower risks a drop towards the lower parallels sub-1.17.
Bottom line: Sterling is testing down-trend support here and leaves the immediate short-bias vulnerable into the start of next week. From a trading standpoint, a good place to reduce short-exposure / lower protective stops. Look for possible downside exhaustion ahead of 1.2080 IF price is going to mount some sort of counter-offensive here. Ultimately a larger recovery may offer more favorable entries closer to trend resistance. Ill publish an updated GBP/USD Price Outlook once we get further clarity on near-term GBP/USD technical levels.
Sterling Trader Sentiment (GBP/USD)

A summary of IG Client Sentiment shows traders are net-long GBP/USD - the ratio stands at +3.13 (75.8% of traders are long) – bearish reading
Traders have remained net-long since May 6th; price has moved 6.4% lower since then
Long positions are 7.7% lower than yesterday and 5.7% lower from last week
Short positions are 5.4% higher than yesterday and 0.1% lower from last week
We typically take a contrarian view to crowd sentiment, and the fact traders are net-long suggests Sterling - GBP/USD prices may continue to fall. Yet traders are less net-long than yesterday and compared with last week. Recent changes in sentiment warn that the current GBP/USD price trend may soon reverse higher despite the fact traders remain net-long.
See how shifts in GBP/USD retail positioning are impacting trend- Learn more about sentiment!
---
Previous Weekly Technical Charts
Gold (XAU/USD)
Crude Oil (WTI)
Canadian Dollar (USD/CAD)
US Dollar (DXY)
Aussie (AUD/USD)
Feragatname:
Bu makaledeki görüşler yalnızca yazarın kişisel görüşlerini temsil eder ve bu platform için yatırım tavsiyesi teşkil etmez. Bu platform, makale bilgilerinin doğruluğunu, eksiksizliğini ve güncelliğini garanti etmez ve makale bilgilerinin kullanılması veya bunlara güvenilmesinden kaynaklanan herhangi bir kayıptan sorumlu değildir.
WikiFX Broker
Son Haberler
Dolar kuru bugün ne kadar? (26 Aralık 2024 dolar - euro fiyatları)
Fahiş fiyata 1 milyon 439 bin liraya kadar ceza
Borsada faiz yükselişi
Sahte dolar fırsatçılığı: 100 dolar 98 dolar olarak bozuluyor
Borsa günü yükselişle tamamladı
Altın fiyatları ne kadar? Gram altın kaç lira? 27 Aralık 2024 altın kuru fiyatları
Bakan Şimşek'ten reeskont kredileri açıklaması
Kur korumalı mevduatta gerileme sürüyor
İş dünyasından faiz açıklaması: KOBİ kredilerine yansıtılmalı
Borsa güne yükselişle başladı
Kur Hesaplayıcı


