简体中文
繁體中文
English
Pусский
日本語
ภาษาไทย
Tiếng Việt
Bahasa Indonesia
Español
हिन्दी
Filippiiniläinen
Français
Deutsch
Português
Türkçe
한국어
العربية
Gold Price Soars Through Resistance, Consolidation Needed Ahead of Next Push
Abstract:Gold broke out of its recent pennant formation to the upside Thursday and may push even higher although a period of consolidation is needed to strengthen the next move.
Gold Price, Analysis and Chart
Gold driven by dovish Fed speak although comments backtracked.
Technical set-up needs strengthening before the next move.
Q3 2019 Gold Forecast and Top Trading Opportunities
Gold Bursts Through Technical Resistance
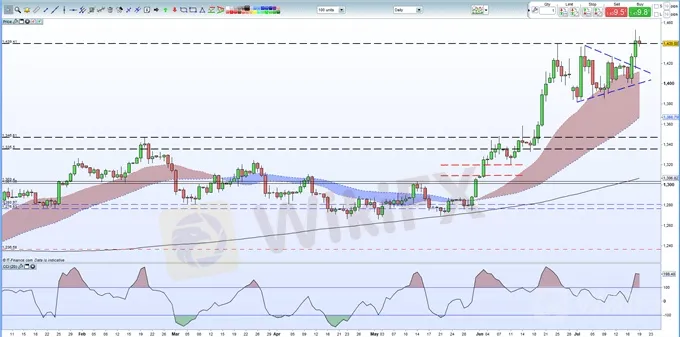
We noted recently that Gold was being constrained by a pennant set-up and that a breakout was likely as the support and resistance trends converged. This formation normally sparks a break-out as buyers and sellers battle to gain control.
Gold Price Nears Sharp Breakout, Silver Price Needs a Driver
Thursdays price action took out the resistance line and allowed Gold to rally to its highest level since May 2013. The precious metal now needs to consolidate above the old resistance trendline before the next push higher. The move was sparked by comments from NY Fed vice chair John Williams who said that the Fed should act quickly to lower rates at the first sign of economic weakness. These comments were rowed back slightly later when Williams said that this was commentary from an academic paper and not solely market based.
How to Trade Gold: Top Gold Trading Strategies and Tips
Gold Price Daily Chart (January – July 19, 2019)

Looking ahead, Gold seemingly has a clear run up to the $1,500/oz.+ level, all things being equal, and may re-test an old gap on the April 08, 2013 weekly candle between $1,496/oz. and $1,540/oz.
Gold Weekly Chart (November 2012 – July 19,2019)

Both charts however show that Gold is currently heavily in overbought territory – using the CCI indicator – and the precious metal may need to consolidate further before making its next move. On the daily and weekly charts all three moving averages continue to remain supportive.
Trading the Gold-Silver Ratio: Strategies and Tips
Traders may be interested in two of our trading guides – Traits of Successful Traders and Top Trading Lessons – while technical analysts are likely to be interested in our latest Elliott Wave Guide.
What is your view on Gold – bullish or bearish? You can let us know via the form at the end of this piece or you can contact the author at nicholas.cawley@ig.comor via Twitter @nickcawley1.
Disclaimer:
The views in this article only represent the author's personal views, and do not constitute investment advice on this platform. This platform does not guarantee the accuracy, completeness and timeliness of the information in the article, and will not be liable for any loss caused by the use of or reliance on the information in the article.
Read more

The U.S. dollar index and U.S. Treasury yields rebounded at the same time; gold fell by more than 1%!
The initial value of the US S&P Global Manufacturing PMI in August was 48, which was lower than expected and the lowest in 8 months; the service PMI was 55.2, which exceeded the expected 54. The number of initial jobless claims in the week ending August 17 was 232,000, slightly higher than expected, and the previous value was revised from 227,000 to 228,000. Existing home sales in July increased for the first time in five months. The PMI data was lower than expected, which was bad for the US eco

The U.S. dollar index returned to the 103 mark; gold once plunged nearly $40 from its intraday high!
The monthly rate of retail sales in the United States in July was 1%, far exceeding expectations; the number of initial claims last week was slightly lower than expected, falling to the lowest level since July; traders cut their expectations of a rate cut by the Federal Reserve, and interest rate futures priced that the Federal Reserve would reduce the rate cut to 93 basis points this year. The probability of a 50 basis point rate cut in September fell to 27%. The data broke the expectation of a

Gold Price Stimulates by Geopolitical Tension
Gold prices experienced their largest gain in three weeks, driven by escalating tensions in the Middle East and the easing of the U.S. dollar as markets await the crucial CPI reading due on Wednesday. Gold has surged to an all-time high above $2,460, as uncertainties surrounding developments in both the Middle East and Eastern Europe persist push the demand for safe-haven assets higher.

KVB Today's Analysis: USD/JPY Eyes Volatility Ahead of BoJ Policy Meeting and US Data
The USD/JPY pair rises to 154.35 during the Asian session as the Yen strengthens against the Dollar for the fourth consecutive session, nearing a 12-week high. This is due to traders unwinding carry trades ahead of the Bank of Japan's expected rate hike and bond purchase tapering. Recent strong US PMI data supports the Federal Reserve's restrictive policy. Investors await US GDP and PCE inflation data, indicating potential volatility ahead of key central bank events.
WikiFX Broker
Latest News
SquaredFinancial offers Trump & Melania meme coins
What is the Best Time to Trade Forex?
Win Rewards & Celebrate Lunar NY with JustMarkets
BBC World Service to axe 130 jobs in bid to save £6m
AI Fraud Awareness Campaign: "We're Not All F**ked"
Crypto.com Delists USDT and 9 Tokens to Comply with MiCA Regulations
How to Use Financial News for Forex Trading?
Fake ‘cyber fraud online complaint’ website Exposed!
GMO-Z com Securities Thailand to Cease Operations in 2025
Oil Prices at $90 to $100 Could Push Philippines Inflation Beyond Target
Currency Calculator


