简体中文
繁體中文
English
Pусский
日本語
ภาษาไทย
Tiếng Việt
Bahasa Indonesia
Español
हिन्दी
Filippiiniläinen
Français
Deutsch
Português
Türkçe
한국어
العربية
Gold Targeting $1,970 Under Short-Term Pressure
Abstract:The U.S. dollar index slipped to a record low of 92.07 under pressure on Monday, spurring gold prices to faster growth and the attempt of $1,970.
WikiFX News (1 Sept) - The U.S. dollar index slipped to a record low of 92.07 under pressure on Monday, spurring gold prices to faster growth and the attempt of $1,970.
The FED Vice Chair Clarida said that an inflation target slightly higher than 2% is appropriate as inflation expectations play a critical role in policy making. This statement indicates that the FED has determined to further stimulate the economy. Subsequently, the dollar index sank to a record low of 92.07 under pressure, while gold prices retreated modestly after being inspired to edge up and attempt the level of $1,970.
The words of Clarida are not surprising and may limit the upside room of gold prices in the near term. Markets before this Friday's Non-Farm Payrolls (NFP) release may show a tame picture of tradings, putting the brakes on the gold volatility..
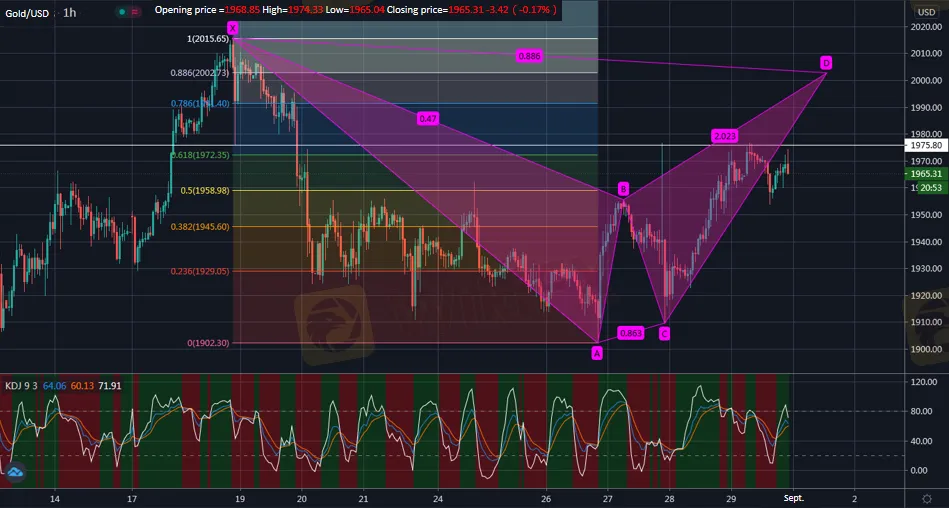
According to gold hourly chart, gold prices are temporarily confined to the area of $1,972-1,976 with a pressure level which is significant in the short term of $1,976, where a breach above is necessary to pave the way for further upside. On the contrary, a failed attempt above the area may bring risks of sharp decline.
Moving forward, with another crucial zone of pressure lying in $2,000-2,002, bearish gold will be inevitably coincided with a distinct downtrend once the upside is defeated ahead of this zone; whereas if the upside claims a victory, another attempt is much more likely to be made to penetrate the earlier high of $2,015 or even higher .
All the above is provided by WikiFX, a platform world-renowned for foreign exchange information. For details, please download the WikiFX App: bit.ly/WIKIFX

Gold Hourly Chart
Disclaimer:
The views in this article only represent the author's personal views, and do not constitute investment advice on this platform. This platform does not guarantee the accuracy, completeness and timeliness of the information in the article, and will not be liable for any loss caused by the use of or reliance on the information in the article.
Read more

Gold Market Technically Analysis
The trend of gold on the daily chart is in line with technical requirements.

Gold Price (XAU/USD) Struggling to Break Meaningfully Higher
Gold Price (XAU/USD) Struggling to Break Meaningfully Higher

Gold Q3 Fundamental Forecast: Outlook Deteriorates for Gold Prices
Gold Q3 Fundamental Forecast: Outlook Deteriorates for Gold Prices

Gold Price Forecast: XAU/USD has a good chance to regain the $1900 level – TDS
Gold Price Forecast: XAU/USD has a good chance to regain the $1900 level – TDS
WikiFX Broker
Latest News
Brazilian Man Charged in $290 Million Crypto Ponzi Scheme Affecting 126,000 Investors
Become a Full-Time FX Trader in 6 Simple Steps
ATFX Enhances Trading Platform with BlackArrow Integration
IG 2025 Most Comprehensive Review
Construction Datuk Director Loses RM26.6 Mil to UVKXE Crypto Scam
SEC Drops Coinbase Lawsuit, Signals Crypto Policy Shift
Should You Choose Rock-West or Avoid it?
Scam Couple behind NECCORPO Arrested by Thai Authorities
Franklin Templeton Submitted S-1 Filing for Spot Solana ETF to the SEC on February 21
Top Profitable Forex Trading Strategies for New Traders
Currency Calculator


