简体中文
繁體中文
English
Pусский
日本語
ภาษาไทย
Tiếng Việt
Bahasa Indonesia
Español
हिन्दी
Filippiiniläinen
Français
Deutsch
Português
Türkçe
한국어
العربية
Gold Price Forecast: Searching for Support After Fed Meeting - Levels for XAU/USD
Abstract:Gold Price Forecast: Searching for Support After Fed Meeting - Levels for XAU/USD
Gold Price Outlook:
Gold prices proved to be the ‘canary in the coal mine’ around the Federal Reserve meeting. Golds weakness hinted at a more hawkish Fed, which yielded a stronger US Dollar.
Gold prices have found initial support around the 50% Fibonacci retracement of the 2020 high/low move.
According to theIG Client Sentiment Index, gold prices have a mixed bias in the near-term.
Canary in the Coal Mine Indeed
Gold prices are searching for support in the wake of the June Federal Reserve policy meeting. Ahead of time, we suggested that “gold is the ‘canary in the coal mine’ for the June Federal Reserve policy meeting this Wednesday. Gold prices have been a beneficiary of the combination of loose fiscal and monetary policy. But if the FOMC signals that taper talk is on the menu (ultimately with a formal announcement regarding a desire to taper in September, followed by technical details in December, and then the start of actual tapering in January 2022), gold prices will lose a potential catalyst that has gilded the path higher over the past year.”
Indeed, with the Fed signaling that rate hikes may arrive as soon as 2023, the narrative around gold prices has been harmed; the tides have turned.
Gold prices have since entered a window of time where US real yields have begun to rise. Shifts in the US Treasury yield curve, on balance, suggesting a period with stronger short- and intermediate-term rates, has been consistent with a stronger US Dollar. As things stand now, its once again an uphill climb for gold prices as investors seeking higher yielding and more growth-sensitive assets.
Gold Volatility and Gold Prices Out of Sync
Historically, gold prices have a relationship with volatility unlike other asset classes. While other asset classes like bonds and stocks dont like increased volatility – signaling greater uncertainty around cash flows, dividends, coupon payments, etc. – gold tends to benefit during periods of higher volatility.
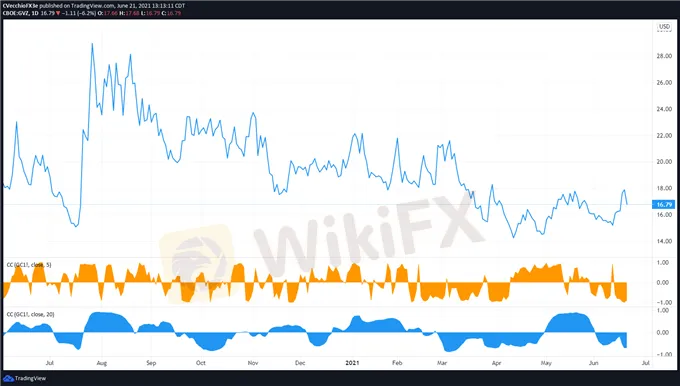
GVZ (Gold Volatility) Technical Analysis: Daily Price Chart (June 2020 to June 2021) (Chart 1)

Gold volatility (as measured by the Cboe‘s gold volatility ETF, GVZ, which tracks the 1-month implied volatility of gold as derived from the GLD option chain) is trading at 16.79. Last week it was noted that “concerningly, despite expanding gold volatility (typically a bullish development for gold prices), spot bullion is falling.” With the relationship between gold prices and gold volatility still out of sync, questions remain about gold price’s ability to sustain a significant rebound. The 5-day correlation between GVZ and gold prices is -0.90 while the 20-day correlation is -0.70. One week ago, on June 14, the 5-day correlation was -0.58 and the 20-day correlation was -0.40.
Gold Price Rate Technical Analysis: Daily Chart (March 2020 to June 2021) (Chart 2)

In the prior gold price forecast, it was noted that “by losing the uptrend from the March and April swing lows, gold price‘s near- and longer-term bullish postures may be imperiled. Bearish momentum has started to accelerate, with gold prices fully below their daily EMA envelope (which is not yet in bearish sequential lower). Daily MACD’s contraction in bullish territory has accelerated, and daily Slow Stochastics have quickly fallen towards oversold territory…if gold prices are the canary in the coal mine for the Federal Reserve meeting this Wednesday, it may be the case that the purported taper timeline being discounted by markets may be too dovish.”
The drop in gold prices has seen a return to the descending channel measured against the August 2020 and January 2021 swing highs. Initial support has been found at the 50% Fibonacci retracement of the 2020 high/low move at 1763.57; the low last week was found at 1761.04. Failure below this confluence of support would suggest a deeper pullback towards 1730 by the end of the month (where time meets the rising trendline from the May 2019 and March 2020 swing lows).
Gold Price Technical Analysis: Weekly Chart (October 2015 to June 2021) (Chart 3)

It‘s been previously noted that “as long as the technical studies remain supportive, the modus operandi is to ’buy the dip, insofar as a bullish breakout from a multi-month bull flag necessitates a bullish trading posture on a longer-term basis.” However, ahead of the FOMC meeting, we stated that “this thesis is being tested in real-time around the FOMC meeting; a change in outlook may soon be necessitated.” Consistent with this perspective, it is now no longer applicable to apply a longer-term bullish view on gold prices; the outlook is decidedly neutral at present time.
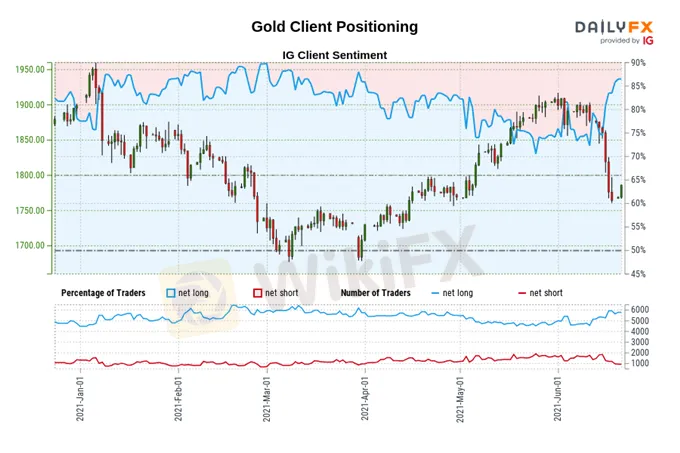
IG CLIENT SENTIMENT INDEX: GOLD PRICE FORECAST (June 21, 2021) (CHART 4)

Gold: Retail trader data shows 86.04% of traders are net-long with the ratio of traders long to short at 6.16 to 1. The number of traders net-long is 6.70% higher than yesterday and 16.60% higher from last week, while the number of traders net-short is 9.93% higher than yesterday and 39.81% lower from last week.
We typically take a contrarian view to crowd sentiment, and the fact traders are net-long suggests Gold prices may continue to fall.
Positioning is less net-long than yesterday but more net-long from last week. The combination of current sentiment and recent changes gives us a further mixed Gold trading bias.

Disclaimer:
The views in this article only represent the author's personal views, and do not constitute investment advice on this platform. This platform does not guarantee the accuracy, completeness and timeliness of the information in the article, and will not be liable for any loss caused by the use of or reliance on the information in the article.
Read more

Easy Trading Online Awarded “Best Forex Broker - Asia” at Wiki Finance EXPO 2024 Hong Kong
We are thrilled to announce that Easy Trading Online has been awarded the “Best Forex Broker - Asia” at the Wiki Finance EXPO 2024 Hong Kong! This prestigious recognition underscores our commitment to excellence and dedication to providing top-notch services to our clients.

Celebrating Excellence of Easy Trading Online at 2024 FastBull Awards Ceremony
On the evening of April 28, Easy Trading Online proudly received the 'Most Trusted Forex Broker' award at the BrokersView 2024, hosted by Fastbull. This accolade is a testament to our steadfast dedication to providing reliable and superior trading services in the forex and CFD brokerage industry.

Easy Trading Online Shines as Gold Sponsor at BrokersView Expo Dubai 2024
The BrokersView Expo Dubai 2024 is a premier event in the financial industry, bringing together top financial institutions, brokers, and technology providers from around the globe. As the Gold Sponsor of BrokersView Expo Dubai 2024, Easy Trading Online took the opportunity to showcase our latest products, service technologies, and core competitive advantages in the forex trading field.

Easy Trading Online at the Wiki Gala Night
On the 23rd of March, the Easy Trading Online family had the distinguished pleasure of being the Table Sponsor at the prestigious Wiki Gala Night. As we reflect on the event, it’s with a sense of pride and joy that we share the highlights and our takeaways from an evening that was as inspiring as it was splendid.
WikiFX Broker
Latest News
Exposing the Top 5 Scam Brokers of March 2025: A Closer Look by WikiFX
Gold Prices Climb Again – Have Investors Seized the Opportunity?
Webull Launches SMSF Investment Platform with Zero Fees
Australian Regulator Warns of Money Laundering and Fraud Risks in Crypto ATMs
The Withdrawal Trap: How Scam Brokers Lure Victims into Paying More
FCA to Investors: Think Twice Before Trusting These Brokers
Trump\s tariffs: How could they affect the UK and your money
Trump gambles it all on global tariffs he\s wanted for decades
TradingView Brings Live Market Charts to Telegram Users with New Mini App
HTFX Spreads Joy During Eid Charity Event in Jakarta
Currency Calculator


