简体中文
繁體中文
English
Pусский
日本語
ภาษาไทย
Tiếng Việt
Bahasa Indonesia
Español
हिन्दी
Filippiiniläinen
Français
Deutsch
Português
Türkçe
한국어
العربية
Dow Jones Technical Analysis: About to Break Major Trendline
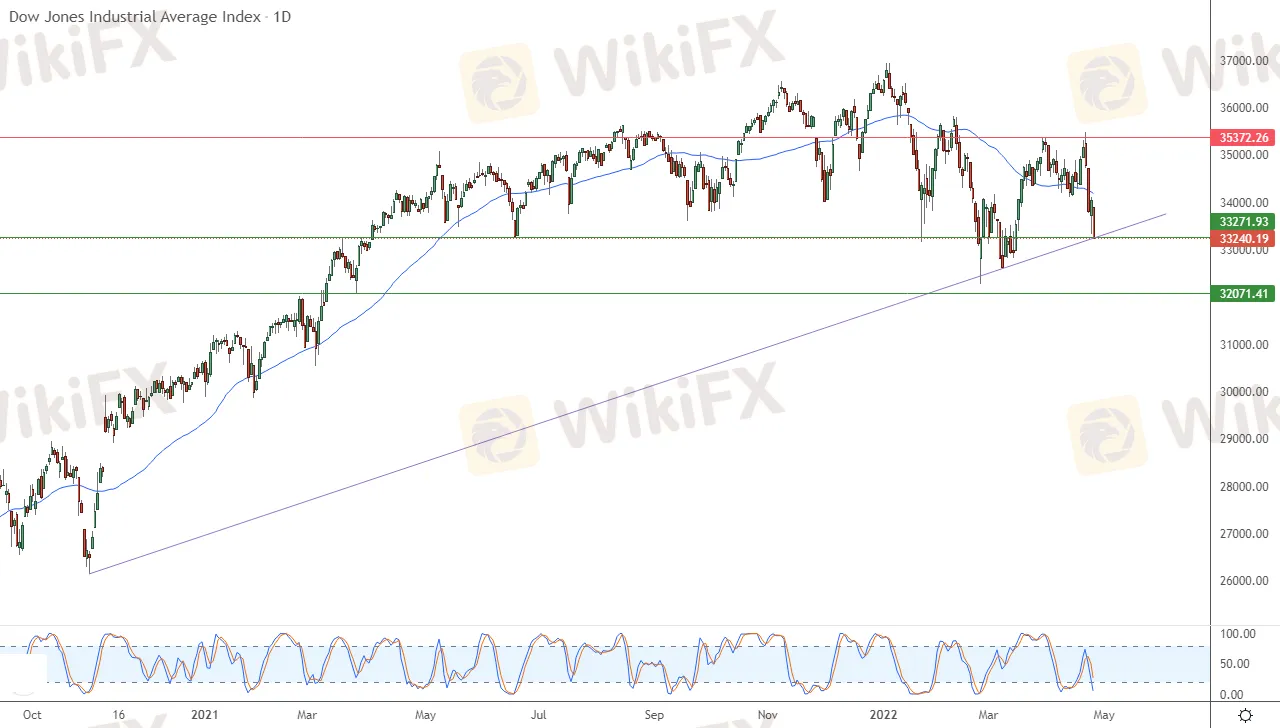
Abstract:The Dow Jones Industrial Average returned to decline during its recent trading at the intraday levels, to suffer sharp losses in its last sessions by -2.38%. The index lost by -809.28 points to settle at the end of trading at the level of 33,240.19, after its decline in Friday's trading by 0.70% .
The Dow Jones Industrial Average returned to decline during its recent trading at the intraday levels, to suffer sharp losses in its last sessions by -2.38%. The index lost by -809.28 points to settle at the end of trading at the level of 33,240.19, after its decline in Friday's trading by 0.70% .
All 30 components of the index declined without one exception, and the stock that fell the most in percentage terms was Nike Inc. Cl B rose -5.80%, followed by Boeing Co. by -0.04%, followed by Visa Inc. Cl A at -4.22%.

The main readings for Tuesday's busy spreadsheet were a small drop in consumer confidence in April, higher home prices, and a slowdown in new home sales. New home sales in the United States fell to 763,000 homes at an annual rate in March from 835,000 homes in February. While the Conference Board's measure of consumer confidence fell to 107.3 in April from 107.6 in March, less than the 108.2 expected in a Bloomberg poll.
Although first-quarter corporate earnings reports were above expectations, this may not be the best representation of what to expect in the future. The Federal Reserve is raising interest rates to stave off high inflation and other threats to global economic growth such as the war between Russia and Ukraine and rising commodity prices remain.
Technically, the index continues to decline amid the dominance of the corrective bearish trend in the short term, with the continuation of negative pressure for its trading below the simple moving average for the previous 50 days. This is in addition to the influx of negative signals on the relative strength indicators, as shown in the attached chart for a daily period, bringing the index down. The latter is based on a major bullish trend line over the medium term.
Therefore, our expectations suggest that the index will continue to decline during its upcoming trading, especially if it breaks the support level 33,271.90, to target immediately after that the first support levels at 32,071.40.
Disclaimer:
The views in this article only represent the author's personal views, and do not constitute investment advice on this platform. This platform does not guarantee the accuracy, completeness and timeliness of the information in the article, and will not be liable for any loss caused by the use of or reliance on the information in the article.
WikiFX Broker
Latest News
Exposing the Top 5 Scam Brokers of March 2025: A Closer Look by WikiFX
Gold Prices Climb Again – Have Investors Seized the Opportunity?
Webull Launches SMSF Investment Platform with Zero Fees
Australian Regulator Warns of Money Laundering and Fraud Risks in Crypto ATMs
The Withdrawal Trap: How Scam Brokers Lure Victims into Paying More
FCA to Investors: Think Twice Before Trusting These Brokers
Trump\s tariffs: How could they affect the UK and your money
Trump gambles it all on global tariffs he\s wanted for decades
TradingView Brings Live Market Charts to Telegram Users with New Mini App
HTFX Spreads Joy During Eid Charity Event in Jakarta
Currency Calculator


